Author: admin

Sensex crashes 2% as bears run riot, 17450 in Nifty would be key level; check support, resistance levels

BSE Sensex and NSE Nifty 50 tanked 2 per cent on Friday as bears prowled Dalal Street. BSE Sensex tanked 1.8 per cent or 1,093 to 58,841, while NSE Nifty 50 tanked 346 points or 2 per cent to finish trade at 17530. Index heavyweights such as Reliance Industries, Infosys, HDFC Bank, Housing Development Finance Corporation, Tata Consultancy Services (TCS), and ICICI Bank among others, contributed the most to the indices fall. Broader markets plunged more than 2 per cent on Friday. S&P BSE MidCap index crashed 3 per cent or 749 points to end at 25,558, while S&P BSE SmallCap index fell 2.4 per cent or 712 points to settle at 29,199. India VIX, the volatility index, jumped 8 per cent to finish at 19.82 level.

Also read: Warning signs flashing for global recession in 2023, as interest rate hikes threaten economic growth

Indian markets were the worst performers in the Asian pack, as higher inflation and likely aggressive rate hikes by the US Fed sent stocks tumbling across the board. We are likely to see strong bouts of volatility in the coming sessions as global slowdown looms large. Technically, the double top formation on daily and intraday charts and bearish candle on weekly charts is indicating further weakness from the current levels. If the index trades above 17450 (which is double bottom support level), then the market is likely to bounce back sharply. For the short term traders, 17450 would be the key level to watch out for, above which, the index could bounce back to the 20 day SMA (Simple Moving Average) 17700 and 17900 levels. On the flip side, below 17450, the index could hit 17300-17200 levels

Deepak Jasani, Head of Retail Research, HDFC Securities

Global stock markets followed Wall Street lower on Friday after higher-than-expected U.S. inflation dashed hopes the Federal Reserve might ease off more interest rate hikes, amid growing concerns of a global recession following warnings from the World Bank and the International Monetary Fund. Nifty ended the week down by 1.59%. Markets seem to have started the downward move after forming a triple top on daily charts over the last three days. On weekly charts, Nifty has formed a bearish Dark Cloud Cover. 17401 and 17170 are the next levels on the downside that may provide temporary support. On up moves, 17771 may be difficult to breach in the near term.

Also read: Gautam Adani becomes world’s 2nd richest person, beats France’s Bernard Arnault as group stocks rally

S Ranganathan, Head of Research, LKP Securities

Indian Markets today finally chose to mirror global cues after out-performing global peers in the recent past. Weaker domestic flows for last month despite SIPs maintaining their run rate led to profit taking as all sectoral indices ended in the red. As global investors brace for a further interest rate hike post the US inflation data released recently, the RBI too has its task cut out in India when they meet at the end of this month. Spectacular Monsoon in India coupled with several positive Tailwinds provides a plethora of investment opportunities in the broader markets.

Vinod Nair, Head of Research, Geojit Financial Services

With persistent bearish pressure from global stocks amid rising yields and dollar index, the domestic market surrendered to the global trend despite its strong decoupling scenario and encouraging macroeconomic data. Post the release of US inflation data, which showcased a MoM increase in inflation, the global market has been pricing in the likelihood of a more aggressive policy response from the Fed.

FII buying trends in India: With current resilience in domestic, global markets, will buying sustain?

By Ram Kalyan Medury

The capital markets of any country are the sum total of all buy and sell actions of all participating investors. There are 3 broad categories of such investors in the markets –

The FII investment trends depend on a lot of factors, but primarily:

the global economy,the economic outlook of the country of the institutional investor andthe economic outlook of the market where the investment is targeted

For instance, FII ownership in the BSE500 index had fallen from near record highs of 21.5% in December 2020 to a decade low of 18.4% by June 2022. Why has this percentage dropped significantly? Here are some factors, while noting that the majority of the FIIs investing in India hail from the US.

The current global geopolitical issues due to the Russia-Ukraine war have set into motion a supply crisis from gas to grains. Inflation triggered by the war and excess liquidity introduced during the Covid-19 pandemic, have made central banks in the West take a tough stance on rate hikes.

The US and the western economies are reeling under high inflation. The consumer price index (mark of inflation) in the US, is at a high of 9.1, the highest since 1981. Fed Chairman Jerome Powell recently made clear that the Fed would continue an aggressive rate hike to reduce inflation.

India has been able to mitigate the impact of high inflation, despite crude reaching $120/barrel. GDP numbers for Q1 of FY2023 were promising at 13.5% per the government-released data. Economic recovery is looking strong across services and manufacturing.

Also read: Wall Street extends losses, US stocks tumble amid Fed tightening jitters, economic rumblings

Based on this data, here is how the FII flows have reversed in the last few months as the economic data in India and the overall narrative have reversed.

Calendar YearTotalJanuary-28526February-38068March-50068April-22688May-36518June-51422July1971August56521September **5066Total 2022-163732

The Ukraine-Russia war is no longer grabbing headlines, with investors more concerned about commodity prices and interest rates, rather than the end of the war. However, we are clearly not out of the woods. The Russia-Ukraine war has not ended and may even take a turn for the worse. While Fed interest rates are now factored in, the expectation that rate hikes will moderate may not materialise as inflation continues to be high and negative surprises can have a global impact There is an expectation among many Western analysts that the overall equity returns will be subdued from most major economies till early 2023. Given these conditions, the net FII flows in this calendar year may remain negative, though the trend now seems to be reversing.

The FIIs being such a dominant force on the markets, sway the markets considerably when they invest or exit. An FII sell-off can actually usher in a market correction. But this trend has changed in India, especially post-pandemic. Retail participation in the markets has increased significantly. There were close to 1.4 crore new Demat accounts opened in FY 2021 alone. The retail participation through mutual funds, ULIPs, Hybrid funds, and Balanced funds have all added up to approximately $14-15 billion in SIPs annually. These inflows are acting as a cushion against any major FII sell-off.

For instance, the DII flows between April 2021 & August 2021 were $7.1 billion. Whereas, FII flows during the same period were just $2.4 billion. During this period, Nifty has gained close to 15%!

Also read: Warning signs flashing for global recession in 2023, as interest rate hikes threaten economic growth

Despite the dull global outlook, India has stronger growth fundamentals compared to other EMs. The Indian domestic economy has shown strength and resilience. The long-term India story not just remains intact but has become stronger post-Covid and Ukraine due to realignment in global supply chains and various other reforms and initiatives undertaken. This augurs well in the long term for the Indian economy and it enjoys the confidence of investors and analysts alike. FIIs have also realized this and sense that the growth engine for the rest of this year for the world, would come from India. Thus, we would be able to see continued inflows from FIIs in the near future.

(Ram Kalyan Medury is the Founder & CEO, Jama Wealth, SEBI Registered Investment Advisor. The views expressed in the article are of the author and do not reflect the official position or policy of FinancialExpress.com.)

Meet Sonali and Manit Rastogi, the duo behind Surat Diamond Bourse; check EXCLUSIVE images of the world’s largest building and know about their journey

Around 90 per cent of the world’s diamonds are cut in Surat and now the city is all set to add another feather to its cap with the newly-opened Surat Diamond Bourse. The building has surpassed the Pentagon as the world’s largest office building.

For the unversed, the Surat Diamond Bourse (SDB) is a diamond trade centre and it will be inaugurated by Prime Minister Narendra Modi in December. The complex is expected to accommodate 67,000 diamond trade professionals across 4,700+ offices. Built at a cost of Rs 3,200 crore, construction of the complex started in 2017 and it is the largest office space in the world.

Who are Sonali and Manit Rastogi?

Sonali Rastogi and Manit Rastogi are Founding Partners at Morphogenesis, one of India’s leading Architecture and Urban Design practices, listed among the top 100 Architectural Firms globally. Both Manit and Sonali have significantly influenced the emerging generation of Indian architects through their involvement in architectural education and as role models for the profession.

Sonali is a leading speaker on sustainable architecture and has lectured at numerous reputed universities and conferences worldwide. She has brought significant attention to gender issues. Today, Morphogenesis stands as an exemplar of the profession for equal opportunity and gender pay parity. A strong proponent of the arts and crafts, Sonali is a founder of Manthan, a platform for creative individuals seeking to share, discuss, and evolve concepts and ideologies.

Manit is a thought leader in the field of sustainable design and has also lectured extensively. He has been on numerous global jury panels and published several research papers on zero-energy buildings. His commitment to a sustainable environment goes beyond the realm of architectural practice—as a founder member of The GRIHA Council, India’s own Green rating system, Manit has worked with urban policymakers to spearhead initiatives with an emphasis on environmental sensibility and social welfare.

About their family and early life

Sonali comes from a family of architects. Growing up in an environment where her living room functioned as an architectural studio, Sonali developed a keen interest in reading, model making, and observing built structures when travelling. Her childhood paved the path for her education and career in architecture.

Manit has had a multicultural upbringing — he grew up in Africa, went to a boarding school in England, and returned to India for his Bachelor in Architecture education in 1986. He comes from a family of engineers but did not want to continue in the same profession. He always knew that he wanted to make things. At one point, he contemplated Genetic Engineering, too, but architecture seemed more appealing. Architecture felt like a profession that would allow him the potential to build something and, at the same time, let him be the generalist across the board. That is why he chose to be an architect; there has been no looking back.

About their journey and career

Manit and Sonali both studied at the School of Planning and Architecture in New Delhi. Manit reflects that the school facilitated discussions beyond the classroom about sociopolitical issues and ideologies of architecture at the time, which was an enriching experience.

After SPA, they went on to study at the Architectural Association (AA), London. While the education helped them understand the various aspects of sustainable design, research, and urban housing, they noticed a severe lack of discourse around Indian architecture on a global level. This motivated them to start their practice, Morphogenesis, in 1996. The practice was envisioned to be their contribution towards putting Indian architecture on the global map.

Their education

Sonali Rastogi commenced her architecture studies at the School of Planning and Architecture (New Delhi) and the Architectural Association (London) with a graduate diploma in Housing and Urbanism under Jorge Fiori and a second graduate diploma in Graduate Design (Design Research Lab) under Jeff Kipnis.

Manit Rastogi commenced his architecture studies at the School of Planning and Architecture (New Delhi) and the Architectural Association (London) with a post-graduate diploma with distinction in Sustainable Environmental Design under Simos Yannas and an AA Diploma with Honours, under John Frazer. The influence of all three programs has formulated and influenced his thinking to date, to create sustainable architecture through the framework of an evolutionary practice inspired by nature, emphasizing passive design.

About the building

With a built-up area of 7.1 million sq. ft. occupying a 35.3-acre site, Surat Diamond Bourse consolidates India’s 67,000-strong diamond community within the world’s largest single-office building. The project exemplifies high-density office architecture and transcends global sustainability benchmarks. SDB is a seed building for the Diamond Research and Mercantile (DREAM) City, an upcoming business district, triggering unprecedented socio-economic development in the region.

Built entirely by the diamond community for the community as a cooperative, the building is a testament to their shared vision and collective agency. With a focus on sustainability, SDB consumes 50% less energy than the highest green benchmarks and features one of the world’s largest radiant cooling systems.

When will PM Modi inaugurate it?

The final date is not confirmed. Tentatively in December.

Credit Suisse risk gauge at record high, shares hit new low

Credit Suisse Group AG’s gauge of credit risk rose to a record high while its stock hit a fresh low, adding to the turmoil after the bank’s attempts to reassure markets on its financial stability backfired. The five-year credit default swaps price of about 293 basis points is up from about 55 basis points at the start of the year and at the highest ever, according to ICE Data Services. At the same time, the shares dropped as much as 12% in Zurich on Monday and have lost about 60% just this year alone, on track for the biggest annual drop in Credit Suisse’s history.

Chief Executive Officer Ulrich Koerner had sought to calm employees and the markets over the weekend only to see his carefully-worded memo have the opposite effect. While touting the bank’s capital levels and liquidity, he acknowledged that the firm was facing a “critical moment” as it worked towards its latest overhaul. He also told employees that he will be sending them a regular update until the firm announces the new strategic plan on Oct. 27. At the same time, Credit Suisse again sent around talking points to executives dealing with clients who brought up the credit default swaps, according to people with knowledge of the matter.

Some prominent figures took to Twitter over the weekend to dismiss some of the rumors prompted by the widened CDS spread as “scaremongering.” Saba Capital Management’s Boaz Weinstein tweeted “take a deep breath” and compared the situation to when Morgan Stanley’s CDS was twice as wide in 2011 and 2012. Koerner, named CEO in late July, has had to deal with market speculation, banker exits and capital doubts as he seeks to set a path forward. The lender is currently finalizing plans that will likely see sweeping changes to its investment bank and may include cutting thousands of jobs over a number of years, Bloomberg has reported.

Koerner’s memo was the second straight Friday missive as speculation over the beleaguered bank’s future increases. Analysts at KBW estimated that the firm may need to raise 4 billion Swiss francs ($4 billion) of capital even after selling some assets to fund any restructuring, growth efforts and any unknowns. Credit Suisse’s market capitalization has dropped to around 9.5 billion Swiss francs, meaning any share sale would be highly dilutive to longtime holders. The market value was above 30 billion francs as recently as March 2021.

Bank executives have noted that the firm’s 13.5% CET1 capital ratio at June 30 was in the middle of the planned range of 13% to 14% for 2022. The firm’s 2021 annual report said that its international regulatory minimum ratio was 8%, while Swiss authorities required a higher level of about 10%. The KBW analysts were the latest to draw comparisons to the crisis of confidence that shook Deutsche Bank AG six years ago. Then, the German lender was facing broad questions about its strategy as well as near-term concerns about the cost of a settlement to end a US probe related to mortgage-backed securities.

Deutsche Bank saw its credit-default swaps climb, its debt rating downgraded and some clients step back from working with it. The stress eased over several months as the German firm settled for a lower figure than many feared, raised about 8 billion euros ($7.8 billion) of new capital and announced a strategy revamp. Still, what the bank called a “vicious circle” of declining revenue and rising funding costs took years to reverse. There are differences between the two situations. Credit Suisse doesn’t face any one issue on the scale of Deutsche Bank’s $7.2 billion settlement, and its key capital ratio of 13.5% is higher than the 10.8% that the German firm had six years ago.

The stress Deutsche Bank faced in 2016 resulted in the unusual dynamic where the cost of insuring against losses on the lender’s debt for one year surpassed that of protection for five years. Credit Suisse’s one-year swaps are still significantly cheaper than five-year ones.

Credit Suisse Group CDS Widens 42 Bps: 12 Signals Since Sept. 16

Last week, Credit Suisse said it’s working on possible asset and business sales as part of its strategic plan which will be unveiled at the end of October. The bank is exploring deals to sell its securitized products trading unit, is weighing the sale of its Latin American wealth management operations excluding Brazil, and is considering reviving the First Boston brand name, Bloomberg has reported.

India second-best performing major market this year

Indian equities have continued to extend their lead over most other major markets and are now the second-best performing market this year after Brazil.

India has returned -10% in dollar terms year-to-date (YTD), far behind Brazil, which has gained 8%. But it’s way ahead of most other major markets like US, Japan, China, Taiwan, France, Germany and South Korea, which have returned -25% or lower.

Nifty 12-month forward P/E, at 18.8x, is at a 2% premium to its long period average of 18.5x. At 2.9x, the 12-month forward P/B stood at a premium of 11% to the Nifty’s historical average of 2.7x.

“India’s valuation premium to its Asian peers remain near all-time high. Amid slowing global demand, lofty market valuations, a slowdown in retail flows and lack of positive catalyst for our earnings estimates, we remain cautious on the overall market returns in the near term,” said Kunal Vora, head of India equity research at BNP Paribas in a recent note.

FPIs withdrew $1.6 billion in September after clocking the highest inflows since December 2020 in the previous month. Outflows stood at $22.6 billion YTD. Domestic institutional investors have turned net buyers at $1.7 billion in September after recording outflows in August. Inflows stood at $28.9 billion YTD.

Also Read: Global bond funds see biggest outflows in two decades

A high current account deficit along with potential FPI outflows, are likely to keep the depreciating bias on the rupee and strain India’s forex reserves. On the positive side, India’s inflation is lower than in developed economies due to the composition of the CPI index. Raw material costs have cooled, which should ease the trade deficit, and another normal monsoon should keep food inflation in check, with GST collections remaining robust at a three-year CAGR of 13%, BNP Paribas said.

“Recessionary fears present a weaker backdrop for global risk assets, and the global outlook remains abnormally uncertain,” added Vora.

US equities, however, surged on Monday and Tuesday on hopes that weakening US manufacturing and jobs data would lead to a change in global central bank policy. Britain’s decision to let go of its controversial plan to cut taxes for the highest earners just 10 days after announcing it has also boosted investor confidence.

Sean Darby, chief global equity strategist at Jefferies, believes that Asian and EM market equities have done well in the backdrop of the Fed tightening, surge in dollar index as well as the ongoing geopolitical tensions between Russia and Ukraine. India’s probably going to do very, very well in the next 12-18 months given that it has managed inflation well and it is not as heavily influenced by the US policy and by China’s growth, he said.

Local or domestic-oriented themes are likely to perform better in the near term, said experts. Banks, automobiles, hospitals, discretionary consumption and domestic industrial themes look attractive in the near term over export and commodity sector themes.

Nifty Bank has outperformed Nifty IT by 40% YTD and substantially bridged the gap of last three years, according to brokerage Motilal Oswal. The weightage of the technology sector fell 530 basis points YTD to 13.8%, while weightage of the consumer sector rose 180 bps to 11.2%. The weightage of private banks grew 140 bps YTD to 23.3%.

“India equities so far have remained insulated from the higher inflation and slower growth worries, and have materially outperformed global peers. However, with interest rates rising globally and the global growth environment incrementally becoming more challenging, equity valuations could come under pressure,” said Jitendra Gohil, head of India equity research, Credit Suisse Wealth Management, India, in a recent note.

“While we continue to believe India remains in a sweet spot and could likely continue to command a valuation premium versus peers due to superior fundamentals, some caution and risk management are warranted,” added Gohil.

US stocks: Wall Street closes with sharp gains as final quarter begins

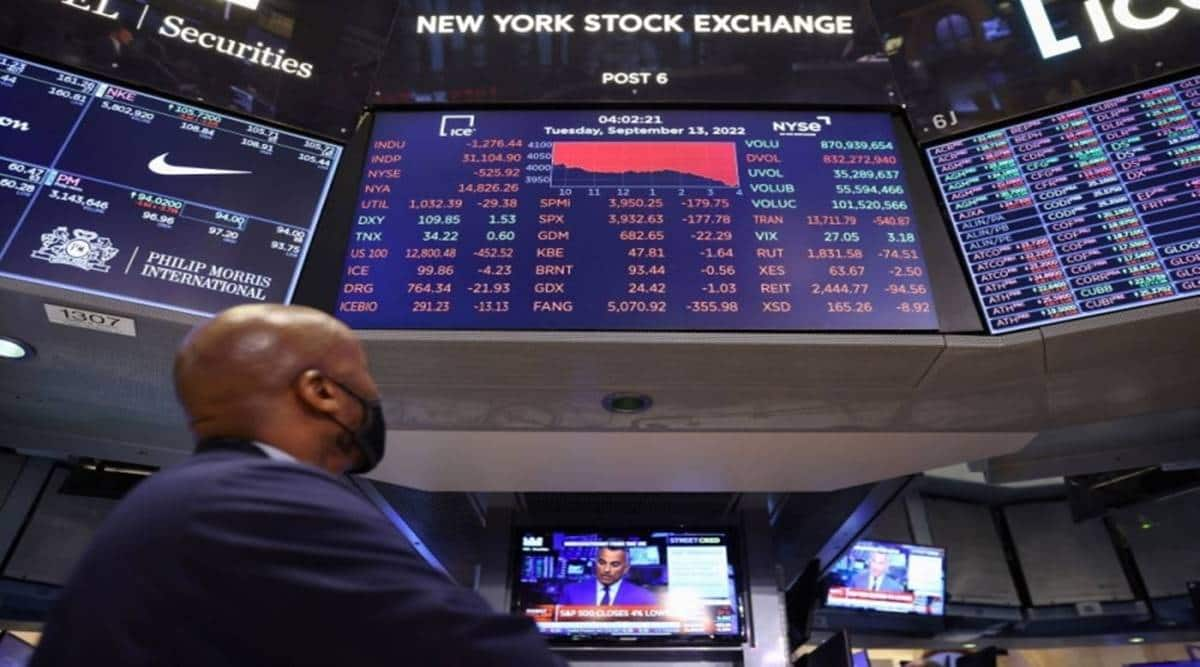
Wall Street‘s three major indexes rallied to close over 2% on Monday as U.S. Treasury yields tumbled on weaker-than-expected manufacturing data, increasing the appeal of stocks at the start of the year’s final quarter. The U.S. stock market has suffered three quarterly declines in a row in a tumultuous year marked by interest rate hikes to tame historically high inflation, and concerns about a slowing economy.

“The U.S. yield markets (are) pulling back – that’s been a positive … and that connotes a more risk-on environment,” said Art Hogan, chief market strategist at B. Riley Wealth in Boston. Further supporting rate-sensitive growth stocks, the benchmark U.S. 10-year Treasury yield fell after British Prime Minister Liz Truss was forced to reverse course on a tax cut for the highest rate.

Also read| GAIL, Bombay Dyeing, HDFC, Avenue Supermarts, Nykaa, Vedanta, Dilip Buildcon stocks in focus

Megacap growth and technology companies such as Apple Inc and Microsoft Corp rose over 3% respectively, while banks advanced 3%. Data showed manufacturing activity increased at its slowest pace in nearly 2-1/2 years in September as new orders contracted, likely as rising interest rates to tame inflation cooled demand for goods.

The Institute for Supply Management said its manufacturing PMI dropped to 50.9 this month, missing estimates but still above 50, indicating growth. “The economic data stream actually came in worse than expected. In a very counterintuitive fashion that likely represents good news for equity markets,” said Hogan.

Also read| Share Market LIVE: Nifty, Sensex may open in green on positive global cues; Electronics Mart IPO opens today

“(While) good economic data, strong readings had been a catalyst for selling, this is the first time we’ve actually seen some negative news be a catalyst.” All three major indexes ended a volatile third quarter lower on Friday on growing fears that the Federal Reserve’s aggressive monetary policy will tip the economy into recession.

The Dow Jones Industrial Average rose 765.38 points, or 2.66%, to 29,490.89; the S&P 500 gained 92.81 points, or 2.59%, at 3,678.43; and the Nasdaq Composite added 239.82 points, or 2.27%, at 10,815.44.Volume on U.S. exchanges was 11.61 billion shares, compared with the 11.54 billion average for the full session over the last 20 trading days.

Tesla Inc fell 8.6% after it sold fewer-than-expected vehicles in the third quarter as deliveries lagged way behind production due to logistic hurdles. Peers Lucid Group gained 0.9% and Rivian Automotive fell 3.1%.Major automakers are expected to report modest declines in U.S. new vehicle sales, but analysts and investors worry that a darkening economic picture, not inventory shortages, will lead to weaker car sales.

Citigroup and Credit Suisse became the latest brokerages to lower 2022 year-end targets for the S&P 500, as U.S. equity markets bear the heat of aggressive central bank actions to tamp down inflation.Credit Suisse also set a 2023 year-end price target for the benchmark index at 4,050 points, adding that 2023 would be a “year of weak, non-recessionary growth and falling inflation.”

Advancing issues outnumbered decliners on the NYSE by a 5.04-to-1 ratio; on Nasdaq, a 2.70-to-1 ratio favored advancers. The S&P 500 posted one new 52-week high and 23 new lows; the Nasdaq Composite recorded 58 new highs and 282 new lows.

Sebi tightens IPO disclosure norms

The Securities and Exchange Board of India (Sebi) has brought in a slew of important changes, including disclosure of key performance indicators (KPIs) in public issues, in its board meeting held on Friday. Other mandates include allowing pre-filing of IPOs, inclusion of units of mutual fund units under insider trading regulations, framework to facilitate online bond platform providers, flexibility in approval process for appointment and removal of independent directors and monitoring of QIP and preferential issue proceeds.

Issuers coming out with IPOs will have to make disclosure of KPIs and price per share of issuer based on past transactions and past fund raising done by the issuer from the investors under ‘Basis for Issue Price’ section of the offer document, and in Price Band Advertisement.

Also Read: Sterlite Power postpones IPO plans on current market volatility

Issuer shall disclose details of pricing of shares based on past transactions and past fundraising from investors based on secondary sale or acquisition of shares during the 18 months period prior to IPO. In case there are no such transactions, information shall be disclosed for price per share of issuer company based on last five primary or secondary transactions, not older than three years prior to IPO.

“The regulator had for several months increased the questioning on pricing of issues and the details of previous issues, including KPIs. They have now made this disclosure mandatory, including for secondary transfers. Some of this may not be known to the issuer, however, will now have to be provided,” said Yash Ashar, partner, head – Capital Markets, Cyril Amarchand Mangaldas.

The Board has given IPO issuers the option to pre-file offer documents. The pre-filing mechanism will allow issuers to carry out limited interaction with without having to make any sensitive information public. Further, the document which incorporates Sebi’s initial observations would be available to investors for a period of at least 21 days

“The pre-filing of offer documents is a well-established procedure in several mature international jurisdictions, aimed at preserving confidentiality of nuanced business and financial information from competitors until an issuer is certain of a launch. This will go a long way in preventing price speculation which currently happens before an IPO,” said Arka Mookerjee, partner, JSA.

The Board has decided to bring mutual fund units under the Sebi (Prohibition of Insider Trading) Regulations, 2015.

“Ambiguity in rules and given that mutual funds are a large asset class, this ambiguity has to go. Since they are different from listed entities, we have chosen to have a new chapter on this so that all processes are clearly defined,” said Buch.

On being asked about the recent SC rulings that went against Sebi in insider trading matters, Buch said the regulator was reviewing its processes and that legislative changes will need to be looked at.

She further said that the norms on ultimate beneficial owners for FPIs had to looked at from a global perspective and in conjunction with exisiting PMLA norms.

On July 8, Sebi had issued a consultation paper with a proposal to include mutual fund units under the purview of insider trading regulations. The regulator doesn’t want those aware of unpublished price-sensitive information to unfairly exit a scheme.

The regulator, in its proposals, has cited the example of a few key personnel of a fund house that were found to have redeemed their holdings in the schemes ahead of an adverse liquidity event while in possession of certain sensitive information that was not communicated to the unit holders of the schemes.

The regulator has made the appointment or removal of independent directors flexible. Currently, this is done through a special resolution. Under the new norms, in case the special resolution for appointment of an independent director does not get the requisite majority, then two other thresholds – ordinary resolution and majority of minority shareholders – would be tested. If the resolution crosses the above two thresholds, in the same voting process, then such a resolution for appointment of the ID would be deemed to be approved by shareholders

The regulator has relaxed certain provisions in the takeover regulations for disinvestments of public sector undertakings (PSUs). This is usually a long-drawn out process and information relating to the same comes in public domain through government decisions and statements made from time to time.

“Considering the unique nature of transaction and process involved in a PSU disinvestment spanning over a long period, such a requirement of determination of open offer price under the takeover regulations many a time, acts as an impediment in fructifying such strategic disinvestment of PSUs. The Board, therefore, approved the proposal to dispense with requirement of calculating 60 days’ VWAMP for determination of open offer price in case of disinvestment of PSU Companies, wherein it results in its change in control, either by way of direct acquisition or indirect acquisition,” the note put out by the regulator said.

The Board allowed net settlement of the cash and F&O segments upon expiry of stock derivatives to facilitate efficient settlement.

“The earlier sequential settlement required investors to bring commitment separately for each transaction. The two were not netted. Any entities which are not mandated to take physical delivery would be now permitted to do net settlement. The cash required for trades can come down significantly,” said Buch.

The regulator has approved monitoring utilisation of issue proceeds raised through preferential issue and qualified institutions placement (QIP) issue.

Online bond platform providers will now have to register with the Sebi as stock brokers under the debt segment of the stock exchanges.

The Board will prescribe a timeline for declaring first close of a scheme of an alternative investment fund, along with the minimum corpus at which the first close may be declared.

Buy RIL, ITC stocks ahead of Union Budget 2021, charts tell; watch these key support levels for Nifty

By Shrikant Chouhan

Last week had been volatile for the traders, the benchmark Index Sensex first time hit the 50000 mark and also registered a fresh all time high of 50184.01/ Nifty 14753.55. But due to short term overbought conditions and profit booking near the psychological 50000 mark, the index failed to sustain at a higher level. Among sectors, the Nifty Auto index gained 3.42 per cent and strong buying was seen in Bajaj-Auto and Tata Motors, which rallied over 10 per cent. Whereas, Nifty Metal, PSU Banks, and Nifty Pharma indices shed over 3.5 per cent.

Bar Reversal kind of candle and daily charts formation indicates red flag near 14750/50185 level. Hence a strong possibility of quick short term price correction if prices move to 14600 levels.

For the next few trading sessions, 14300/48400 should be the sacrosanct level for the trend following traders, if it sustain above the same then uptrend texture likely to continue up to 14600-14750/48800-49100 further upside may also possible that could life the index till 14855/49450. On the flip side, dismissal of 14300/48400 possibly open another leg of correction till 14100-13950/48100-47600.

Reliance Industries Ltd: Buy

The stock has made a strong comeback in the previous week and closed above the multi resistance area of 2040. It has also taken an exit from the bearish triangle at an upside that would lift the stock to 2150/2200 in the near term. Buy at current levels 2045, Stop Loss at 2000 and Target at 2200.:

ITC: BUY

Since the stock has broken the level of 210 it is trending upward. Currently it is consolidating between the range of 225 and 205. In the previous week we saw the stock is correcting to 209, which is the lower boundary of the consolidation and is giving better risk reward. Our advice is to buy at current levels with a final stop loss at 205. On the higher, it could bounce back to 220/225 levels.

Shriram Transport Finance Company: SELL

It has formed lower high formation at 1276 as compared to earlier highest level, which was at 1317. On a daily and weekly basis, it closed below the level of 1164, which is negative for it. Our advice is to sell at resistance 1175/1180 with a final stop loss at 1210. Below the level of 1164, the stock may even fall to 1100 or 1080 levels.

(Shrikant Chouhan is Executive Vice President – Equity Technical Research at Kotak Securities. The views expressed are personal. Please consult your financial advisor before investing)

Will bulls take a backseat as bears drag Nifty below 17800? 5 things to know before market opening bell

Bulls are likely to take backseat on Friday as SGX Nifty hinted at a negative start for Indian equities. Nifty futures traded 111 points, or 0.62% lower at 17,768 on the Singapore Exchange, signaling that NSE Nifty 50 and BSE Sensex were headed for a negative start. “We broadly remain positive on the markets and suggest buying on dips. Nifty trades with a positive bias on monthly basis but short term momentum indicators suggest some jitters. This could result in a phase of correction/consolidation. IT and select BFSI stocks remain attractive while Banking can witness some profit booking,” said Sahaj Agrawal, Head of Research- Derivatives at Kotak Securities.

Also Read: Adani Ports, PVR, Tata Power, UPL, Reliance, BPCL, Ami Lifesciences stocks in focus on 16 September 2022

Technical view: “A long negative candle was formed on the daily chart, that has engulfed the long bull candle of Wednesday on the downside. Technically, this market action signal emergence of selling pressure at the resistance of 18100 levels. On the downside, the Nifty is expected to find support around 17750-17700 levels in the short term. The short-term trend of Nifty continues to be range bound around 18100-17700 levels. There is a possibility of further consolidation or minor downward correction in the short term,” Nagaraj Shetti, Technical Research Analyst, HDFC Securities.

Levels to watch for: “The trading set up suggests that a fresh round of selling is possible only after the dismissal of 17800 support level. If the index trades above 17800 then it could retest the level of 18100- 18150. On the flip side, below 17800, a quick intraday correction is not ruled out. Below which, it could slip till 17700-17650,” said Shrikant Chouhan, Head of Equity Research (Retail), Kotak Securities. Bank Nifty has support at 40700 levels while resistance at 41700 levels, according to technical charts.

IPO watch: Harsha Engineers IPO was subscribed 10.35 times on day two. The reserved portion of non-institutional investors witnessed a subscription of 24.91 times. Retail Investors saw a robust demand and was subscribed 9.14 times. The employee portion was subscribed 6.34 times. The qualified institutional buyer portion was subscribed 1.63 times. The issue kicked off for subscription on Wednesday, September 14, and will close today (September 16).

Also Read: Sensex, Nifty fall for 2nd straight day on weekly F&O expiry; Bank Nifty looks bullish, use buy on dips

Stocks under F&O ban on NSE: Indiabulls Housing Finance and RBL Bank are the two equities under the NSE F&O ban list for September 16. Securities thus banned under the F&O segment include companies where derivative contracts have crossed 95 percent of the market-wide position limit.

Rupee likely to depreciate on strong dollar, risk aversion in markets, weak Asian peers; USDINR may hit 81

The Indian rupee likely to depreciate on Friday amid risk aversion in equity markets, weak Asian peers, and strong dollar. Spot USDINR now has resistance in the area of 81.25 to 81.40, according to analysts. In the previous session, rupee tanked to close at an all-time low against the US dollar after the US Federal Reserve’s interest rate hike and its hawkish stance weighed on investor sentiments. The US Fed’s rate hike and escalation of geopolitical risk in Ukraine led to sapped risk appetite which weighed on the domestic unit, according to Forex traders. At the interbank foreign exchange market, rupee opened at 80.27, and ended at 80.86, down 90 paise over its previous close.

Also Read: Share Market LIVE: Nifty, Sensex may open in red amid weak global cues; big consolidation drive at Tata Steel

“The Indian rupee is expected to open slightly lower and may face resilience around 81 in anticipation of the central bank’s intervention. However, the direction will depend on broad-based dollar movement. The forward market is indicating that USDINR could open around 80.95. Spot USDINR now has resistance in the area of 81.25 to 81.40, while the previous top 80.12 is likely to act as support. Asian stocks headed for a sixth weekly decline following another day of losses for US shares and surging Treasury yields that underscore expectations for tighter monetary policy and a slowing global economy.”

Anindya Banerjee, VP, Currency Derivatives & Interest Rate Derivatives, Kotak Securities

“USDINR spot closed at 80.86, up 89 paise, to all-time high. Post super hawkish Fed and sell-off in equity markets, there was significant unwinding of shorts in the dollar. The central bank seems to have not intervened aggressively. However, in the coming sessions, we expect RBI to step in and contain volatility. Therefore, a range of 80.40 and 81.20 can be seen.”

Gaurang Somaiya, Forex & Bullion Analyst, Motilal Oswal Financial Services

“Rupee fell to fresh all-time lows following a surge in the dollar after the Fed raised interest rates by another 75 basis points and signalled more large increases at its upcoming meetings. The Fed’s new projections showed its policy rate rising to 4.4% by the end of the year, before peaking at 4.6% in 2023 to curb uncomfortably high inflation. Fed Chairman said there is no painless way to bring inflation down, reiterating that it wants to act aggressively now and keep at it. Yen fell after the Fed policy statement and also after the Bank of Japan maintained a dovish stance. The BoJ came in to support the yen soon after Europe opened.”

Also Read: Will bears drag Nifty towards 17400 amid weak global cues? 5 things to know before share market opening bell

“Volatility and uncertainty have risen as the market comes to grips with a policy regime that is reducing liquidity after a decade of abundance. Apart from BoJ, the Bank of England released its policy statement and raised rates by another 50bps and said it would continue to “respond forcefully, as necessary” to inflation, despite the economy entering recession. The BoE now expects inflation to peak at just under 11% in October, below the 13.3% peak it forecast last month. Today, focus will be on preliminary manufacturing PMI number from the US, EZ and the UK. We expect the USDINR(Spot) to trade sideways and quote in the range of 80.70 and 81.20,” Somaiya added.

(The recommendations in this story are by the respective research analysts and brokerage firms. FinancialExpress.com does not bear any responsibility for their investment advice. Capital markets investments are subject to rules and regulations. Please consult your investment advisor before investing.)